
Two real satellite visits, two different evidence limits
Compare two historic Copernicus Sentinel-2 observations near Bega, New South Wales. Inspect the true-colour data, a conservative scene-classification mask and the evidence limits before treating visual differences as land-cover change.
Free to explore. Worksheet inputs stay in this browser tab; no account or paid API is required.
The data below comes from 26 December 2019 and 20 January 2020, on MGRS tile 55HGV. The images are processed crops of Sentinel-2 Level-2A data. No burn area, damage severity, causal attribution or current condition is claimed.
Compare tile metadata with a local pixel mask
5% maximum whole-tile cloud cover
Loading the observation processing record.
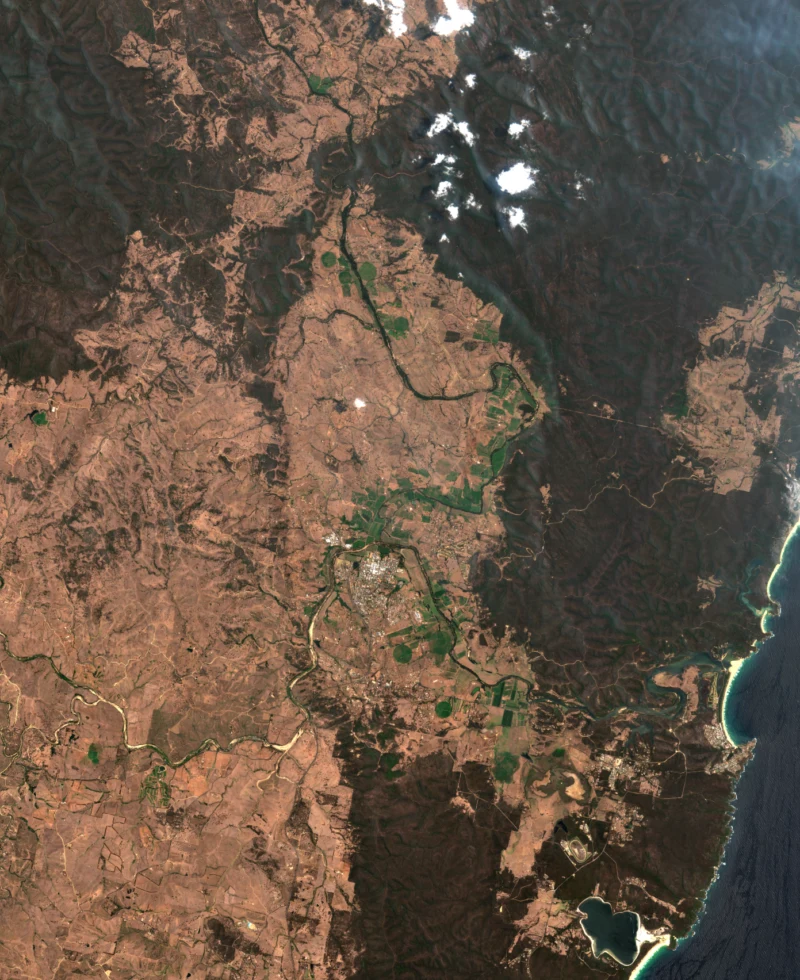
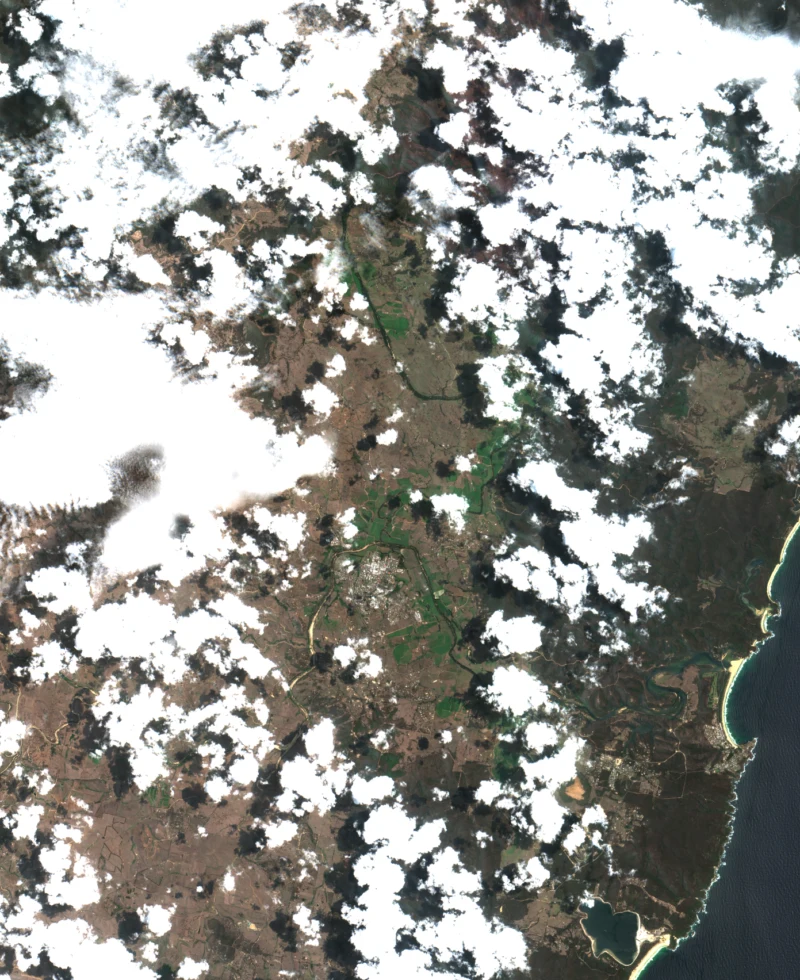
The SCL display also includes dark features, shadows, unclassified pixels, cloud and snow/ice. The downloadable processing record identifies all class counts. Colours are a visual key, not a ground survey.
What was actually processed?
The area of interest is longitude 149.7–150.0° east and latitude 36.8–36.5° south. Both observations use grid 55HGV, projected CRS EPSG:32755 and processing baseline 02.13. RGB and mask previews share the same projected crop bounds.
Statistics are calculated from native 20 m SCL pixels. The example retains classes 4 (vegetation), 5 (not vegetated) and 6 (water), excluding the other classes. This deliberately conservative screen is not a universal definition of usability. Its suitability depends on the actual monitoring task.
The whole-tile cloud percentage describes a much larger scene. The locally retained percentage describes this crop under this particular rule. Neither is the percentage of land that changed. Preview RGB uses bilinear resampling; classification preview uses nearest-neighbour sampling.
What is validated, and what is still missing?
The source identifiers, dates, grid, CRS, processing baseline and shared crop bounds have been checked. The previews are derived from named RGB and SCL assets rather than synthetic imagery. Those checks make the processing traceable; they do not validate an interpretation of change.
- No independent field validation or labelled accuracy assessment has been performed.
- SCL classes are algorithmic estimates and can be wrong; haze, smoke and mixed pixels still require inspection.
- Different platforms, illumination, viewing conditions and processing assumptions can affect comparison.
- A defensible change claim needs a task-specific method, uncertainty treatment and independent evidence.
At the default 5% whole-tile filter, the December observation passes and the January observation is excluded. Raising that threshold changes catalogue eligibility, not what the pixels prove.
Sources and attribution
Contains modified Copernicus Sentinel data 2019 and 2020, processed for this MGCA example in October 2026. Cloud-Optimized GeoTIFF distribution: Element 84 Earth Search / AWS Open Data.
Take the next step with context
Keep the question, assumptions and evidence together. These tools help organise a review; an exported record does not approve a design or certify a system.